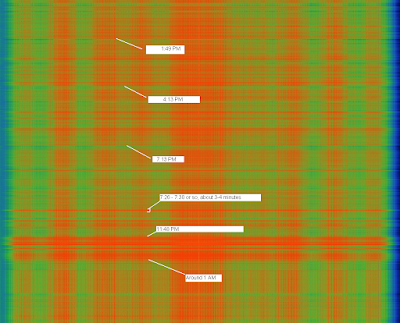
I wondered if cell tower activity slopes off during the night so I did a long-term waterfall using the method I described previously. I figured that since people do most of their talking, texting, and moving around during the day but leave their phone by their bed at night, there should be significantly less dynamic power change on the downlink as it gets later.
I chose half of the CDMA signal near my home, one of the ones Ywsia1 says has little activity. I also disabled the AGC so my SDRplay would not keep compensating on the gain reduction.
The picture below spans from 11:51 AM on Sunday, October 16, 2016 to 4:10 AM the next day with the usual 1 vertical pixel = 1 minute, with +/- <1 second accuracy.
Here's an annotated version:
To my surprise, the day did not show much activity but things really heated up from about 11:48 PM to 1 AM.


No comments:
Post a Comment