Monday, October 17, 2016

Charting cell tower activity

I wondered if cell tower activity slopes off during the night so I did a long-term waterfall using the method I described previously. I figured that since people do most of their talking, texting, and moving around during the day but leave their phone by their bed at night, there should be significantly less dynamic power change on the downlink as it gets later.

I chose half of the CDMA signal near my home, one of the ones Ywsia1 says has little activity. I also disabled the AGC so my SDRplay would not keep compensating on the gain reduction.

The picture below spans from 11:51 AM on Sunday, October 16, 2016 to 4:10 AM the next day with the usual 1 vertical pixel = 1 minute, with +/- <1 second accuracy.


Here's an annotated version:


To my surprise, the day did not show much activity but things really heated up from about 11:48 PM to 1 AM.

Thursday, October 13, 2016

Info on IS-95 (cdmaOne)

IS-95, I'm told by several sources, is one of the signals I've seen and which is half of the double signal provided on my cellphones page. Recently I did some reading on the standard. It turns out it was the predecessor of CDMA2000, which a lot of modern phones use. You may notice if you have a Verizon phone that the Internet will go out and the top bar will say "1X" when a phone call is in progress. That's your phone dropping 3G (or 4G) and switching down to CDMA2000 to make or receive the call. My phone, however, is on Cricket and switches down to 4G from LTE when I make calls.

IS-95 looks easy to decode because it only uses QPSK, never QAM. I found an interesting college lecture on the standard: http://www.pitt.edu/~dtipper/2720/2720_Slides9.pdf.

You'd think that IS-95 networks would have been shut down long ago, but like analog cell phones they may be required by law to keep the networks going until the FCC decides, or maybe enough people still use 2G phones that it's worth it.

When I contributed the first 3G signals on sigidwiki.com, Ywsia1 was quick to identify them and noted that he couldn't hear much traffic being handled (you can tell if you use AM). That's understandable, considering how far out I live, so when I was near Hanahan recently I recorded about 2 minutes of what appears to be IS-95. Look at an excerpt from the PDF linked above:


When I measured the bandwidth of the vast majority of the energy contained in the signal, it spanned from 862.281 to 863.509 MHz. That's 1.228 MHz! You can find a copy of this signal on the cellphones page.

When I recorded the sample I used slightly more amplification and aimed the antenna better, so if you measure the width you may come up with a little more. However, when the signal wasn't so strong, most of the energy was indeed contained within precisely 1.228 MHz.

[Update 10/14/2016]

CDMA2000 is considered 3G while IS-95 is 2G. I wondered if any modern phones could use IS-95, and I think I found a recent one on Amazon that can. Notice how it specifies both 2G and 3G CDMA.


----


I learned that a Costas Loop is instrumental in demodulating QPSK, so I spent a while yesterday trying to put one together. I took a 1200-baud Inmarsat signal and saved it into a 4800Hz wave file (pictured below).


Then I watched a YouTube video that explained the Costas Loop. I wrote a Java app that would multiply the I and Q channels by 2cos(ft) and -2sin(ft), respectively.

Once that was done, I combined the 2 channels back into a wave file and played it in HDSDR. I now had 2 peaks, one at -1200 Hz and another at 0 Hz. I was initially excited, thinking that the -1200 Hz peak meant I had guessed the rate on the first try and my program had found something, but I now think it may be entirely generated by the program and that the peak would be at any frequency I had entered.

Anyway, the next step is to low-pass filter the output so you don't get the high mixer product. I didn't know how to low-pass outside of Audacity so I skipped that step and just opened the resulting wave file in Audacity. I used the Nyquist command (mult (aref *track* 0)(aref *track* 1)) to multiply the tracks by each other and see if any error signal would show up. To my surprise, both tracks became completely zeroed out. I wondered how that could be, so I did Undo, amplified the original tracks, and then re-did the Nyquist. This time, it stayed flat for almost the whole file and then slowly ramped up. Click to enlarge.


This seems like a slowly-increasing error signal, but I couldn't be sure because I had skipped the low-pass step. Today I used Audacity to do that. I amplified first, then tried to do a 2400 Hz lowpass filter, but it told me that was impossible since my file was 4800 Hz. Then I realized that I had to enter 1200 Hz. After that I used the Nyquist command to produce the error signal and got this:


Here is the "error signal" both amplified and zoomed in:


There was a huge peak in the original file, so I don't know that that matters much.

Wednesday, September 21, 2016

Centering (downmixing) a signal

Ever want to record a signal but your SDR just didn't have a suitable bandwidth? That's an issue on the SDRplay. If you have a 2.5 MHz signal, for example, the least bandwidth you can use is 5 MHz. That's a lot to record when you just want one signal. And what if you need to use large bandwidth to offset the signal from the center so the DC spike doesn't mess it up? The DC spike can be a huge, almost insurmountable problem in the GHz bands. See the picture below.


Apparently if you record as a WAV and open with Audacity, you can multiply both tracks by a sine wave to shift an off-center signal to the center. However, I don't know how you'd do this for a signal on the left since Audacity doesn't accept negative values.

Here's how it's done, based in part on advice from Steve the Fiddle on the Audacity mailing list:

  1. Open your IQ file
  2. Split it to mono and remove the right track
  3. Create a mono track and generate a sine wave of the desired frequency
  4. Make Stereo Track
  5. Open Nyquist Prompt and run this:
  6. (mult (aref *track* 0)(aref *track* 1))
  7. Remove one side (both will be the same) and save as a mono wav file.
  8. Repeat with the right channel.
  9. Open a new Audacity project and combine the 2 files you just created.
  10. (Obvious) The original left channel (I) must be the left channel in the resulting file, and the same with the right channel (Q).
  11. Finally, see that it worked using HDSDR or something similar.


This is what it looked like when I used a 550 kHz tone. You can see that it's not perfectly centered because 550 kHz was not quite right, but it's very close.


Seeing the double signal, I initially thought I had created a lower sideband but upon closer examination I saw that it was not mirrored like AM should be, but rather duplicated, so this apparently works. You can see the faint carrier at both plus and minus 550 kHz along with the higher, non-mirrored duplicate of the signal.

I then low-pass filtered in Audacity (Effect->Low Pass Filter) to 900 kHz to get just the desired signal.


Now it's much easier to see how off-center it still is. Finally, here's a picture of this in SpectraVue:


This has significant implications not just for analysis but for saving space on IQ recordings.

Monday, September 12, 2016

1st Anniversary Post

Yesterday was a full year since I discovered how to decode HTDV on the SDRplay. While I couldn't think of anything cool to publish yesterday, I did take my SDR setup with me today. I live out in the country where very little happens and wanted to see how much was going on in the city. My first test was on the 3rd floor of a building. I had trouble seeing any 3G towers (even my new 4G phone reports 1 bar at times around here), but I did see an unfamiliar walkie-talkie protocol called Cap+, which DSD+ can mostly decode. I barely made out some people talking about Highway 17 and LED traffic cones/markers. After I got VB Cable running and the audio levels good, I was able to hear conversations between employees of a pest control company. It was about 9:24 AM when I got it working well, and I heard a worker say he'd be late for his 9:15 appointment and ask the office to call the customer and let her know. However, I did not get any noticeably better reception from being 3 stories up. I couldn't even get more than a faint trace of NOAA radio.

Later I went to a library (only 2 stories but with more comfortable sitting areas) and was able to get what I strongly believe is a 3G signal along with something a little lower that may be GSM.


Measuring crudely, the wide one is 3.9 MHz which is close to the expected 3.84 MHz of a 3G signal. Wikipedia also reports that the downlink band in question spans 1930 to 1990 MHz, and it looks like these are skirting the bottom edge.

I'm still hard at work studying DSP in my spare time. I found a bug in the Python scripts I released. I shouldn't have used the radians() function. That t variable in sin(2*pi*f*t) was just time, not time as degrees.

While there's not much I can currently do on the cell phones project, I can still take IQ recordings and add them to the cellphones page. Taking my equipment in public today has allowed me to record some 2G GSM, which I don't really have where I live.

While I may never be able to get much from a cell phone downlink, I hope to at least see some indication that I'm close, even if it's just a PSK/QAM constellation. So far the chances are looking slim, but I'm not too discouraged because this is how the HDTV experiment began. At that time I had searched for months without success. It really looked like there was no possible solution to watching TV on the SDRplay, but I wouldn't accept defeat. Of course I am realistic and if the TV issue had been a hard limit in the SDR's chips then I would have quit. I only continued because I could see that it just needed a software solution.

Anyway, my efforts ended up paying off and I'm surprised at how popular my TV post continues to be. It shows that almost anything is possible with enough effort. I hope my cellphones/3G project will be just as rewarding.

Friday, September 9, 2016

Update: AM in Quadrature

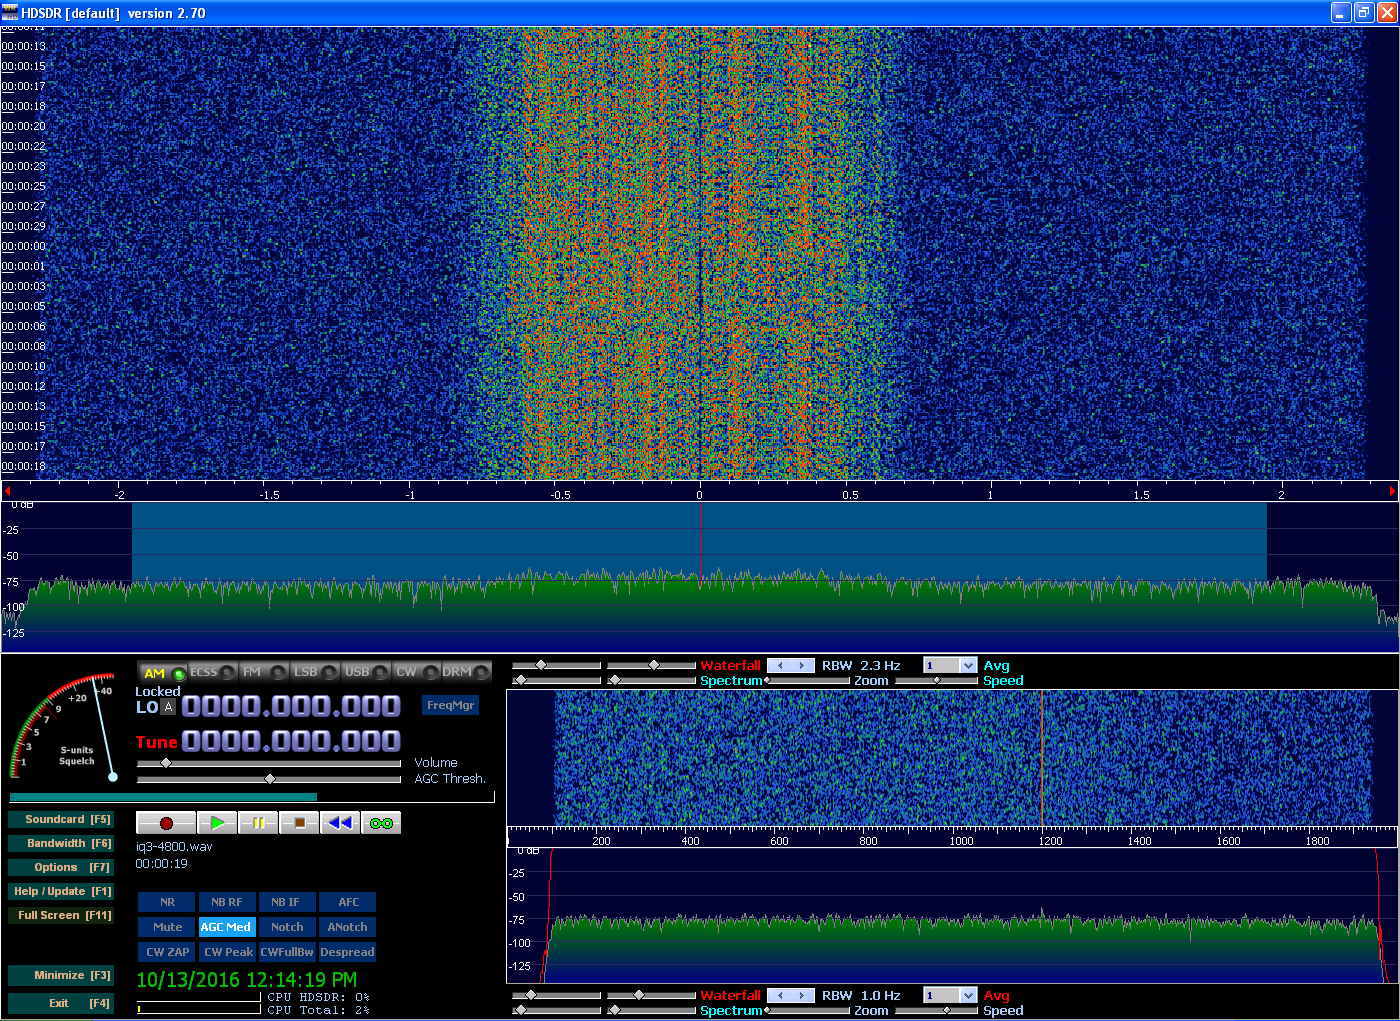
I wrote a new version of my AM modulator that does quadrature. When you use a plain cosine wave (f(x) = cos(x) rather than f(x)=cos(2*pi*freq)), it makes a carrier that is almost at 0. Suppressed-carrier mirrored audio is always present in the center of my quadrature output, and it corrupts the desired signal if you don't modulate it onto a higher frequency than 0, as pictured.


You may be asking, why cosine? Because I saw that the waveform of a sine is 90 degrees ahead of a cosine, and unless I'm mistaken the Q should come 90 degrees after the I. Using I=sin and Q=cos, it was backwards. Yesterday this drove me crazy until I realized and corrected the mistake in the script.

It makes the difference of which side of 0 the signals end up on. Here's a picture of how it should look:


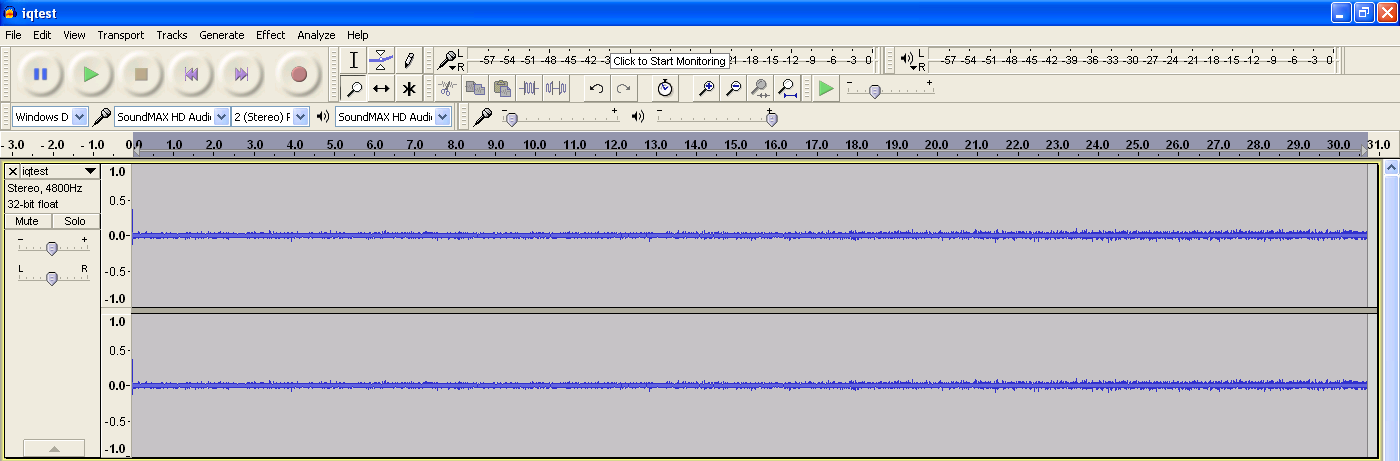
Something I noticed is that if you increase the frequency value inside the script then the output sin/cos waves will look distorted in Audacity. However, the audio demodulated by HDSDR sounds great either way, so it's not distorting much.

Wave when f=2


Wave when f=12


I also found an interesting relationship between frequency (the f in sin(2*pi*f)), the file's sampling rate, and the resulting signal center frequency.

The original audio file was 48 kHz and so was the quadrature output since the script copies the headers. When f=12, the AM signal's center frequency was about 10.1 kHz. When I fed the script a copy of the audio that was upsampled 4x to 192 kHz, the center frequency became 40.2 kHz. Changing f from 12 to 2 while keeping the 192 kHz rate made a precisely 6.7 kHz signal. In the case of 192 kHz that means (center_frequency / f) = 3.35.

In the case of 48 kHz, the constant is different. I generated a file with f=2 and a rate of 48 kHz to see the constant. In this scenario, the carrier wasn't on an easily readable frequency boundary, so I set RBW to 0.2Hz and zoomed in fully. I estimated it to be 1.675 kHz.


Well, it turns out I was only 8 Hz off. Rearranging the formula above: if constant = (center_frequency / f), then

centerfrequency = constant * f

With 48 kHz, the constant is 0.841667, so the center frequency is 1.683 kHz.

And one more relationship to tie it all together: notice how the constant for 192 kHz is close to 4x the constant for 48 kHz. So close, in fact, that we can approximate this:

constant(sampling_rate) = ~0.0175 * sampling_rate

where sampling_rate is kHz, not Hz. However, note that this is an approximation for estimation purposes and is NOT as accurate as the f versus center frequency constants.

Finally, here's the Python script used to generate everything illustrated here. It makes separate I and Q mono WAV files which you must put together as left and right stereo channels, respectively.

------------------
import math

def radians(degrees):
    return (degrees/360)*2*math.pi


#plt.axis([0,1000,0,255])
#plt.ylabel('some numbers')
samples=1000000
x=[]
i=[]
q=[]
multiplier=[]
demod=[]
amp=1
freq=2 #1/8
phase=0
for d in range(samples):
    x.append(d)
    #y.append(amp*math.sin((2*math.pi*freq*radians(d))+phase))
    sinwavevalue=math.sin(radians(2*math.pi*freq*d))
    coswavevalue=math.cos(radians(2*math.pi*freq*d))
    i.append((coswavevalue/2)+0.5)
    q.append((sinwavevalue/2)+0.5)
    #multiplier.append(amp*math.sin((2*math.pi*freq*radians(d))+phase))

#for element in range(len(y)):
    #demod.append(y[element]*multiplier[element])
#plt.plot(x,demod)
#plt.plot(x[0:1000],y[0:1000])
#plt.show()
bytepos=0
with open("D:/time8a.wav","rb") as infile: #Input File
    with open("D:/time_am_f2_i.wav","wb") as o: #Output file
       
    #byte = i.read(1)
        for idx in range(0,44):
            byte=infile.read(1)
            o.write(byte)
       
        while byte:
            bytepos +=1
            if (bytepos == samples):
                break
            test=float(float(int.from_bytes(byte,byteorder="big"))*i[bytepos])
            #test=float(127*i[bytepos])
            #print(int.from_bytes(byte,byteorder="big")," * ",y[bytepos]," = ",float(float(int.from_bytes(byte,byteorder="big"))*y[bytepos]))
            tmp = [int(test),]
            #print(bytes(tmp)," (",int(test),")")
            o.write(bytes(tmp))
            byte = infile.read(1)


bytepos=0
with open("D:/time8a.wav","rb") as infile: #Input File
    with open("D:/time_am_f2_q.wav","wb") as o: #Output file
       
    #byte = i.read(1)
        for idx in range(0,44):
            byte=infile.read(1)
            o.write(byte)
       
        while byte:
            bytepos +=1
            if (bytepos == samples):
                break
            test=float(float(int.from_bytes(byte,byteorder="big"))*q[bytepos])
            #test=float(127*q[bytepos])
            #print(int.from_bytes(byte,byteorder="big")," * ",y[bytepos]," = ",float(float(int.from_bytes(byte,byteorder="big"))*y[bytepos]))
            tmp = [int(test),]
            #print(bytes(tmp)," (",int(test),")")
            o.write(bytes(tmp))
            byte = infile.read(1)

Thursday, September 8, 2016

Homemade AM modulator

I recently got into Python and wrote an AM modulator. I learned the idea from a free PDF called Think DSP. The concept is really simple and just involves multiplying audio samples by sine wave samples. It was a bit difficult where I had to cast bytes into floats and then back again. This is a no-brainer in Liberty BASIC, but I stuck with Python and got it working the same day.

I have previously tried to write processing software for sound but failed. I thought the sound samples might be a weird logarithm that must be undone, but during this project I saw that sound is intuitive to work with and produces the expected results if you use 8-bit unsigned WAV. Being unsigned, it gives you values from 0 to 255, which really is simple to manipulate, and Audacity will show the expected waveform when you open it.

My Python script takes an input wave file and multiplies 100,000 samples by a sine wave. To save the trouble of having to use Audacity's Raw Audio import feature, the script copies the WAV headers to the new file. The output audio length therefore isn't accurate but Audacity and HDSDR have safeguards to avoid reading too far.

Here's the resulting output in HDSDR.


One more thing before I share the script: this is a mono WAV file, which is why HDSDR's frequency scale starts at 0 on the left. I tested with a stereo 8-bit WAV and HDSDR considers it to be IQ and centers 0 on the frequency scale, with negative and positive frequencies on either side. This is good to know for when I start generating quadrature signals. 


And now the script:
-----------------
#import matplotlib.pyplot as plt
import math

def radians(degrees):
    return (degrees/360)*2*math.pi


#plt.axis([0,1000000,-1,1])
#plt.ylabel('some numbers')
x=[]
y=[]
multiplier=[]
demod=[]
amp=1
freq=18 #18 corresponds to 15.075 kHz in this case (see picture above)
phase=0
for d in range(1000000):
    x.append(d)
    #y.append(amp*math.sin((2*math.pi*freq*radians(d))+phase))
    y.append(math.sin((2*math.pi*freq*radians(d))+phase))
    #multiplier.append(amp*math.sin((2*math.pi*freq*radians(d))+phase))

#for element in range(len(y)):
    #demod.append(y[element]*multiplier[element])
#plt.plot(x,demod)
#plt.plot(x,y)
#plt.show()
bytepos=0
with open("D:/time8a.wav","rb") as i: #Input File
    with open("D:/time_am_hf18.wav","wb") as o: #Output file
        
    #byte = i.read(1)
        for idx in range(0,44):
            byte=i.read(1)
            o.write(byte)
        
        while byte:
            bytepos +=1
            test=float(float(int.from_bytes(byte,byteorder="big"))*((y[bytepos]/2)+0.5))
            #print(int.from_bytes(byte,byteorder="big")," * ",y[bytepos]," = ",float(float(int.from_bytes(byte,byteorder="big"))*y[bytepos]))
            tmp = [int(test),]
            #print(bytes(tmp)," (",int(test),")")
            o.write(bytes(tmp))
            byte = i.read(1)
-----------------

Tuesday, September 6, 2016

Sep 6 update

The cellphone project is currently paused as I figure out a substitute for Signals Analyzer. It's rumored the author is dead, and the program severely distorts your signals unless you enter the key. Trango on #hackrf helped me troubleshoot and determine what was wrong. I uploaded a small IQ file and shared it with him, and he followed some steps and analyzed the signal. I followed his instructions with that file and got only noise, after which he realized it was a joke by the author. Sure enough, I found a page online that confirms this.

Until I find a new analyzer, the cellphone project will have to be postponed. I'm currently studying DSP for another project and once I get all the concepts I may be able to do a little analysis from scratch.